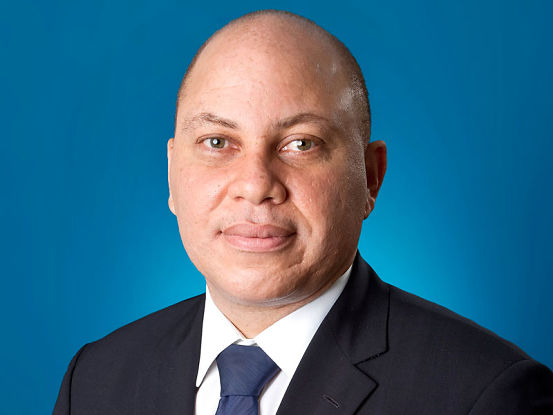
Mr. Gary Barrow, CD
Chief Executive Officer Wigton Energy Limited (WIG)
In a bold move set to redefine Jamaica’s energy and electric vehicle (EV) landscape, Wigton Energy Limited (WIG) has taken control of Flash Holdings Limited, raising its stake to 51 per cent. This acquisition, while strategic in accelerating the roll-out of EVs under subsidiary Flash Motors Company Limited (FMCL), also signals a deeper ambition: Wigton’s emergence as the Caribbean’s leading multi-solution renewable energy powerhouse.
Yet behind the headlines of Wigton’s pivot from its windfarm legacy lies an even more intriguing opportunity – one involving Tropical Battery Company Limited, the decades-old Jamaican battery and solar energy firm currently in the throes of a J$1.79-billion (US$11.09-million) secondary share offering.
The offering, extended for a second time to July 4, is designed to reduce debt and graduate the company from the Junior Market to the Main Market of the Jamaica Stock Exchange – a critical step in Tropical Battery’s quest to list on Nasdaq within the next three to five years.
The question on the minds of investors and analysts is simple: Could Tropical Battery become Wigton’s next big strategic play?
From Wind to Multi-Solution Renewables
Founded as Wigton Windfarm, the company rebranded in late 2024 to Wigton Energy Limited, reflecting a strategic pivot towards diversified clean energy solutions. Alongside wind, Wigton is now advancing solar photovoltaic (PV) projects, battery storage systems, and EV infrastructure – creating a full-suite renewable energy model.
The acquisition of Flash Holdings is a testament to this vision. Wigton’s initial 21 per cent stake, valued at J$112 million (just over 1 per cent of its total assets), was symbolic – an entry point into the EV market. The June 2025 expansion to majority control demonstrates serious intent to scale electric mobility, not only distributing EVs but enabling the charging infrastructure needed to drive adoption across Jamaica and, ultimately, the region.
Tropical Battery’s Debt, Expansion, and Nasdaq Dreams

Alexander Melville Chief Executive Officer Tropical Battery Company Limited
Meanwhile, Tropical Battery is fighting its own battles. Founded in 1950, the company has evolved into an integrated battery distributor, solar energy provider, and EV solutions player, with strategic acquisitions in Silicon Valley (Rose Electronics) and the Dominican Republic (Kaya Energy).
Yet its rapid expansion has come at a cost. Tropical is carrying significant debt, including a US$9.5-million bridge loan from CIBC Caribbean Bank and a maturing J$300-million bond. The current APO seeks to raise at least J$1 billion to stabilise its balance sheet, improve working capital, and clear the path to Main Market graduation and Nasdaq listing.
But with two extensions announced in quick succession, questions loom about investor appetite. Institutional investors have reportedly requested more time for internal processes – a potential window for strategic partners like Wigton Energy to step in.
By participating significantly in Tropical Battery’s APO, Wigton could secure a meaningful minority stake – potentially 10-20 per cent – positioning itself on Tropical’s board and integrating the firm’s battery manufacturing and distribution network into Wigton’s renewable energy and EV ecosystem.
Why This Alliance Makes Sense
On paper, Wigton and Tropical Battery are perfectly complementary.
| Wigton Energy |
Tropical Battery |
| Wind, solar, BESS, EV distribution |
Batteries, solar, EV services |
| Local grid expertise, renewable projects |
US and regional market access, battery manufacturing |
| Expansion capital and project development capability |
Need for strategic investor to reduce debt and scale |
A Playbook for Execution
Strategic Capital Injection: Wigton could anchor Tropical’s APO, sending a strong market signal and stabilising Tropical’s financial base.
Board Influence & Governance: Securing a board seat would align Tropical’s expansion with Wigton’s regional clean energy goals.
Joint Ventures for EV Charging: Tropical’s battery and solar solutions combined with Wigton’s utility-scale renewable projects could fast-track the installation of EV charging stations powered by clean energy – a win-win for emissions goals and revenue streams.
BESS & Grid Services: As Jamaica’s grid modernises, battery energy storage systems (BESS) will be critical for stabilisation and integration of renewables. Wigton and Tropical are both invested in this space, but collaboration could enable larger projects with better financing terms and risk sharing.
Nasdaq Roadmap: Tropical’s ambitions to list on Nasdaq could be strengthened by Wigton’s institutional backing, while Wigton benefits from the valuation uplift of an equity partner expanding into North America.
Risks and Realities
Of course, execution risks remain. Tropical’s debt burden must be managed carefully to avoid operational strain. Cultural and operational integration will require disciplined governance structures. For Wigton, investing in a non-controlling stake carries the challenge of influencing strategy without direct operational control – a delicate dance that only strong board-level partnerships can navigate.
The Bigger Picture
Ultimately, the strategic logic is compelling. Together, Wigton and Tropical Battery could create a vertically integrated clean energy and EV solutions group with:
✅ Renewable generation capacity
✅ Battery manufacturing and storage solutions
✅ EV distribution and charging infrastructure
✅ Access to regional and North American markets
This is exactly the model that global energy giants are pursuing: controlling the entire clean energy value chain to drive long-term sustainable revenues.
“The Caribbean Tesla?”
 As the Caribbean accelerates its renewable energy transition, the region needs companies with the vision, capital, and integration capability to deliver clean energy solutions at scale. Wigton’s rebranding is more than cosmetic; it is a bet on becoming the Tesla of the Caribbean – not only in EVs, but in energy storage, solar, and grid services.
By partnering with Tropical Battery, Wigton could create an ecosystem that powers Jamaica’s homes, businesses, and vehicles with clean, resilient energy – a transformative step towards the island’s 50 per cent renewable energy target by 2030.
And perhaps, in the years ahead, when investors search for the Caribbean’s first clean energy unicorn, it will be this strategic alliance they point to as the moment the region’s energy future changed forever.
Foot Notes
Company Overviews & Recent Moves
Wigton Energy Limited (WIG)
- Rebranded from Wigton Windfarm in November 2024 to reflect its pivot toward diversified renewables—wind, solar, batteries, and now EVs.
- Broadening into solar PV (won ~50 MW project in 2024), and developing battery storage alongside EV infrastructure.
- June 2025: boosted its stake in EV distributor Flash Holdings from 21% to 51%, aiming to fast‑track EV rollout via Flash Motors (FMCL). Wigton also provided corporate guarantees for FMCL loans
Tropical Battery Company Limited
- Jamaica-based battery and solar energy firm, listed in 2020; now distributes Mac Battery brand, solar solutions, and even sells Tesla vehicles
- Acquired Silicon Valley-based Rose Electronics and Dominican solar firm Kaya Energy; revenue doubled in late 2024 but profit fell due to debt
- Currently launching a J$1.79 billion (~US$11M) secondary share offering—now closing July 4—aimed at trimming debt and enabling migration from JSE Junior to Main Market, with Nasdaq aspirations in 3–5 years
Business Model Synergies
| Area |
Wigton Energy |
Tropical Battery |
| Core Offering |
Wind, PV, storage, EV distribution |
Automotive batteries, solar, energy storage |
| Geographic Reach |
Jamaica (grid), regional expansion |
Jamaica, US (Silicon Valley), Dominican Rep. |
| Debt/Capital |
Asset-based growth, moderate debt |
Significant debt load, seeking equity raise |
| Strategic Goals |
Full-suite renewables + EV market |
Debt elimination, market upgrade, Nasdaq prep |
There’s a strong alignment in battery energy storage systems (BESS) and EV charging infrastructure. Tropical’s access to the US market and grid storage tech aligns with Wigton’s ambition to become a “multi-solution renewable provider.”
Could Tropical Battery Be an Acquisition or Investment Target?
Acquisition—Full or Partial
Full acquisition improbable: Tropical’s valuation (~US$11M) and upcoming debt clearance means it’s not distressed enough to sell entire control cheaply.
Strategic merger: WIG could acquire a controlling minority stake—e.g., buying current shareholders’ stock and participating in the APO. This could integrate Tropical’s distribution and manufacturing capacity into Wigton’s ecosystem.
Participating in APO
With WIG’s guidance, investing in the July 4 APO (minimum J$1B) positions its shareholding favorable—potentially 10–20%+ depending on uptake.
This gives Wigton influence in Tropical’s board and strategic decisions without full takeover.
Strategic Alliance Framework
Coordinated capital raise: Wigton leads or coordinates participation in the APO, signalling stability and boosting investor confidence.
Cross‑shareholding : Tropical could take a stake in FSMC (Flash Motors), aligning EV ambitions and creating a shared EV–battery value chain.
Joint BESS & EV infrastructure roll‑out: Co-develop charging & storage solutions across WIG’s solar/Wind sites and Tropical’s commercial distribution footprint.
Regional market expansion: Tropical supports EV battery servicing and solar projects from its Jamaica/US base, while Wigton provides local grid integration and regulatory experience.
IPO/Nasdaq roadmap: Wigton’s participation helps Tropical graduate to JSE Main then aim for Nasdaq—giving Wigton a stake in a growth IPO narrative.
How This Can Be Executed
Due diligence: Wigton assesses Tropical’s balance sheet post-IPO, tech integration capabilities (e.g., Silicon Valley assets), and debt reduction efficacy.
Negotiation: Restructure APO conditions to secure stakes with board representation.
Legal integration: Form joint ventures for EV charging deployments and BESS installations, sharing risk and scaling faster.
Capital partnership: Align Tropical’s Nasdaq ambitions with Wigton’s institutional backing—opening a new funding channel.
Summary
While a full takeover of Tropical Battery isn’t likely and may not be necessary, strategic participation in its APO offers Wigton:
- Entry into battery manufacturing & EV services.
- A way into the US through Silicon Valley tech.
- Leverage Solar/BESS synergy.
- A shot at future upside via Tropical’s equity if it lists on Nasdaq.


 Businessuite Women1 week ago
 Businessuite News243 weeks ago

 Businessuite News242 weeks ago
 Businessuite News24 International3 weeks ago
 Corporate Feature3 weeks ago
 Businessuite Markets2 weeks ago

 Business Insights2 weeks ago
 Businessuite Women3 weeks ago







 As the Caribbean accelerates its renewable energy transition, the region needs companies with the vision, capital, and integration capability to deliver clean energy solutions at scale. Wigton’s rebranding is more than cosmetic; it is a bet on becoming the Tesla of the Caribbean – not only in EVs, but in energy storage, solar, and grid services.
 When Mr. Tyrone Wilson, Chairman, President, and CEO of Kintyre Holdings (JA) Limited, stepped into the additional role of Chief Executive Officer at Visual Vibe—alongside his existing portfolio—industry observers took note. His move, following the resignation of Chief Investment Officer Andrew Wildish, now consolidates strategic, operational, and governance control under one leader across the two connected companies.
 FosRich is primarily a distributor of electrical, lighting, and solar energy products. FosRich aims to differentiate itself from its competitors in the Jamaican marketplace by providing a quality and cost effective service, and by collaborating with clients on technical solutions. FosRich partners with large global brands seeking local distribution such as Huawei, Philips Lighting, Victron Energy, Siemens, NEXANS and General Electric. FosRich has a staff complement of two hundred and forty (240) people across ten (10) locations in Kingston, Clarendon, Mandeville, and Montego Bay. FosRich also has a team of energy and electrical engineers who offer technical advice and install solar energy systems, solar water heaters and electrical panel boards.

 Key Financial Highlights