Connect with us

RANKING

#1 Sagicor Financial Corporation Businessuite 2019 Top Barbados Company by US$ Profit after Tax

Published

on

The Sagicor Group delivered strong operational performance for financial year 2018.

Each business segment grew their revenue, and each delivered positive net income, in spite of significant one-time items, in particular the restructuring of the Government of Barbados debt (GoB). We are pleased with our performance in the face of these challenges.

Total revenue increased 22% to US$1,484.3 million, compared to the prior year amount of US$1,218.6 million, an increase of US$265.7 million.

All segments experienced year on year growth.

The largest single source of revenue growth was increased premiums in the USA segment driven by a strategic direction to increase production and to cease reinsurance and retain 100% of production starting in Q2 2018. In addition, fee income grew significantly in the Jamaican segment due in part to growth in investment banking business.

Group net income was US$103.0 million, compared to US$115.9 million in the prior year. Net income attributable to shareholders was US$43.7 million, compared to US$72.4 million in the prior year, a reduction of US$28.7 million. Both Group net income and net income attributable to shareholders were affected by the GoB restructuring.

Management estimates that absent the GoB restructuring, net income attributable to shareholders would have been US$82.9 million, representing growth of 15%.

Benefits were US$765.3 million, compared to US$659.4 million for the prior year, an increase of 16%. The growth in benefits (which include actuarial provisions for future benefits) reflects and is consistent with our revenue growth.

Expenses were US$590.7 million, compared to US$436.4 million for the prior year, driven in part by US$95.5 million of credit impairment provisions, which were partially offset by positive change in actuarial liabilities related to restructured debt.

Administrative expenses grew 13% to US$303.1million, as the company incurred one-time costs related to its ongoing transaction with Alignvest Acquisition II Corporation.

Commissions and related compensation grew 19% to US$117.3 million, in line with growth in premiums.

Income taxes were US$50.7 million. This compared to US$19.3 million in the prior year when the Company had a one-time tax benefit of US$14.2 million in the USA segment arising from the Tax Cuts and Jobs Act.

The remaining increase in taxes resulted from growth in taxable lines of business.

Group comprehensive income was US$38.9 million, compared to US$180.1 million for the prior year, a decrease of US$141.2 million. Group comprehensive income in 2018 included the provision for GoB debt restructuring. Group comprehensive income in 2017 also benefited from significant gains on available for sale assets and retranslation of foreign currency assets, both of which reversed to losses in 2018.

Group assets were US$7.3 billion and Group liabilities were US$6.2 billion, resulting in Group equity of US$1.1 billion, compared to US$0.9 billion in the prior year.

Shareholders’ equity was US$600.9 million, compared to US$624.6 million for the prior year.

The Group’s debt was US$490.3 million, with a debt to capital ratio of 30.2%, compared to 30.6% for the prior year. The increase in the Group’s debt is related to the debt of the Sagicor X Fund Group, which remains unchanged, but is now consolidated onto our balance sheet.

Sagicor has fully provisioned for the exchange of GoB debt as agreed with the Government of Barbados. On September 7, 2018 the Government of Barbados (GoB) entered into a Staff-Level Agreement with the International Monetary Fund (IMF) to provide financial and technical assistance.

As part of the programme, the GoB announced on October 15, 2018 that its Exchange Offer received unanimous support from the domestic creditors including Sagicor. The Sagicor Group has made a gross provision of US$98.8 million and took a charge, net of offsetting adjustments, of US$48.8 million attributable to shareholders.

During the year the Sagicor Group adopted two new accounting standards which became effective from January 1, 2018: IFRS 15, Revenue from Contracts with Customers, which affects how income is recognised on contracts by companies, and IFRS 9, Financial Instruments. IFRS 9 changes the way that financial instruments are recognised and measured. The standard introduces new measurement categories for financial instruments and an expected, instead of an incurred, credit loss model for impairment.

In addition, our subsidiary Sagicor Group Jamaica, was deemed to have effective control of Sagicor X Fund Group from October 1, 2018 based on its shareholding and influence, and from that date has accounted for Sagicor X Fund as a subsidiary as required by IFRS 10. This change has resulted in the operations, results and balance sheet of Sagicor X Fund Group being included within the financial statements.

This has the effect of increasing assets and debt on our consolidated balance sheet, including a significant increase in non-controlling interests in subsidiaries.

The discontinued operations represent our UK business, which was sold in 2013. During 2018 there were positive developments in this exposure which resulted in net income of US$7.1 million. At close of the year the company carried a receivable of US$17.2 million in respect of this business which was settled by a cash payment to us in February 2019 to fully close off our exposure to this business.

Sagicor voluntarily adopted Canadian risk based capital and reserving standards in 1991. The capital ratio, “Minimum Continuing Capital and Surplus Requirements” (MCCSR) seeks to demonstrate to stakeholders the financial strength of the company.

Canadian regulators expected insurance companies to maintain an MCCSR ratio of 150%. And Sagicor has consistently maintained a ratio above 200%. As at the end of the year our MCCSR Ratio was 234%.

Sagicor is rated on an annual basis by Standard and Poor’s Global Ratings and Fitch Ratings. We have been rated by S&P since 2006 and Fitch since 2015. These ratings are an independent measure of our financial strength. Current ratings are as follows:

  • S&P – BB –
  • Fitch – BB –

On November 27, 2018, Sagicor Group announced that it had entered into a transformative transaction with Alignvest Acquisition II Corporation (Alignvest) which heralds in yet another significant milestone in our long and storied history.

Through this transaction, Sagicor will acquire a listing on the Toronto Stock Exchange, where we will have international exposure, greater access to capital to fund growth and be exposed to proper price discovery for our shares, providing an opportunity to unlock fair value for all shareholders.

At the same time, Sagicor also announced that Sagicor and Alignvest will acquire Scotiabank’s life insurance operations in Jamaica and in Trinidad & Tobago. The completion of the transaction with Alignvest is expected in the second half of 2019, subject to shareholders’ approval and customary regulatory approvals.

Stephen McNamara Chairman Sagicor Financial Corporation

To view full 2018 Annual Financial Report click HERE
RANKING

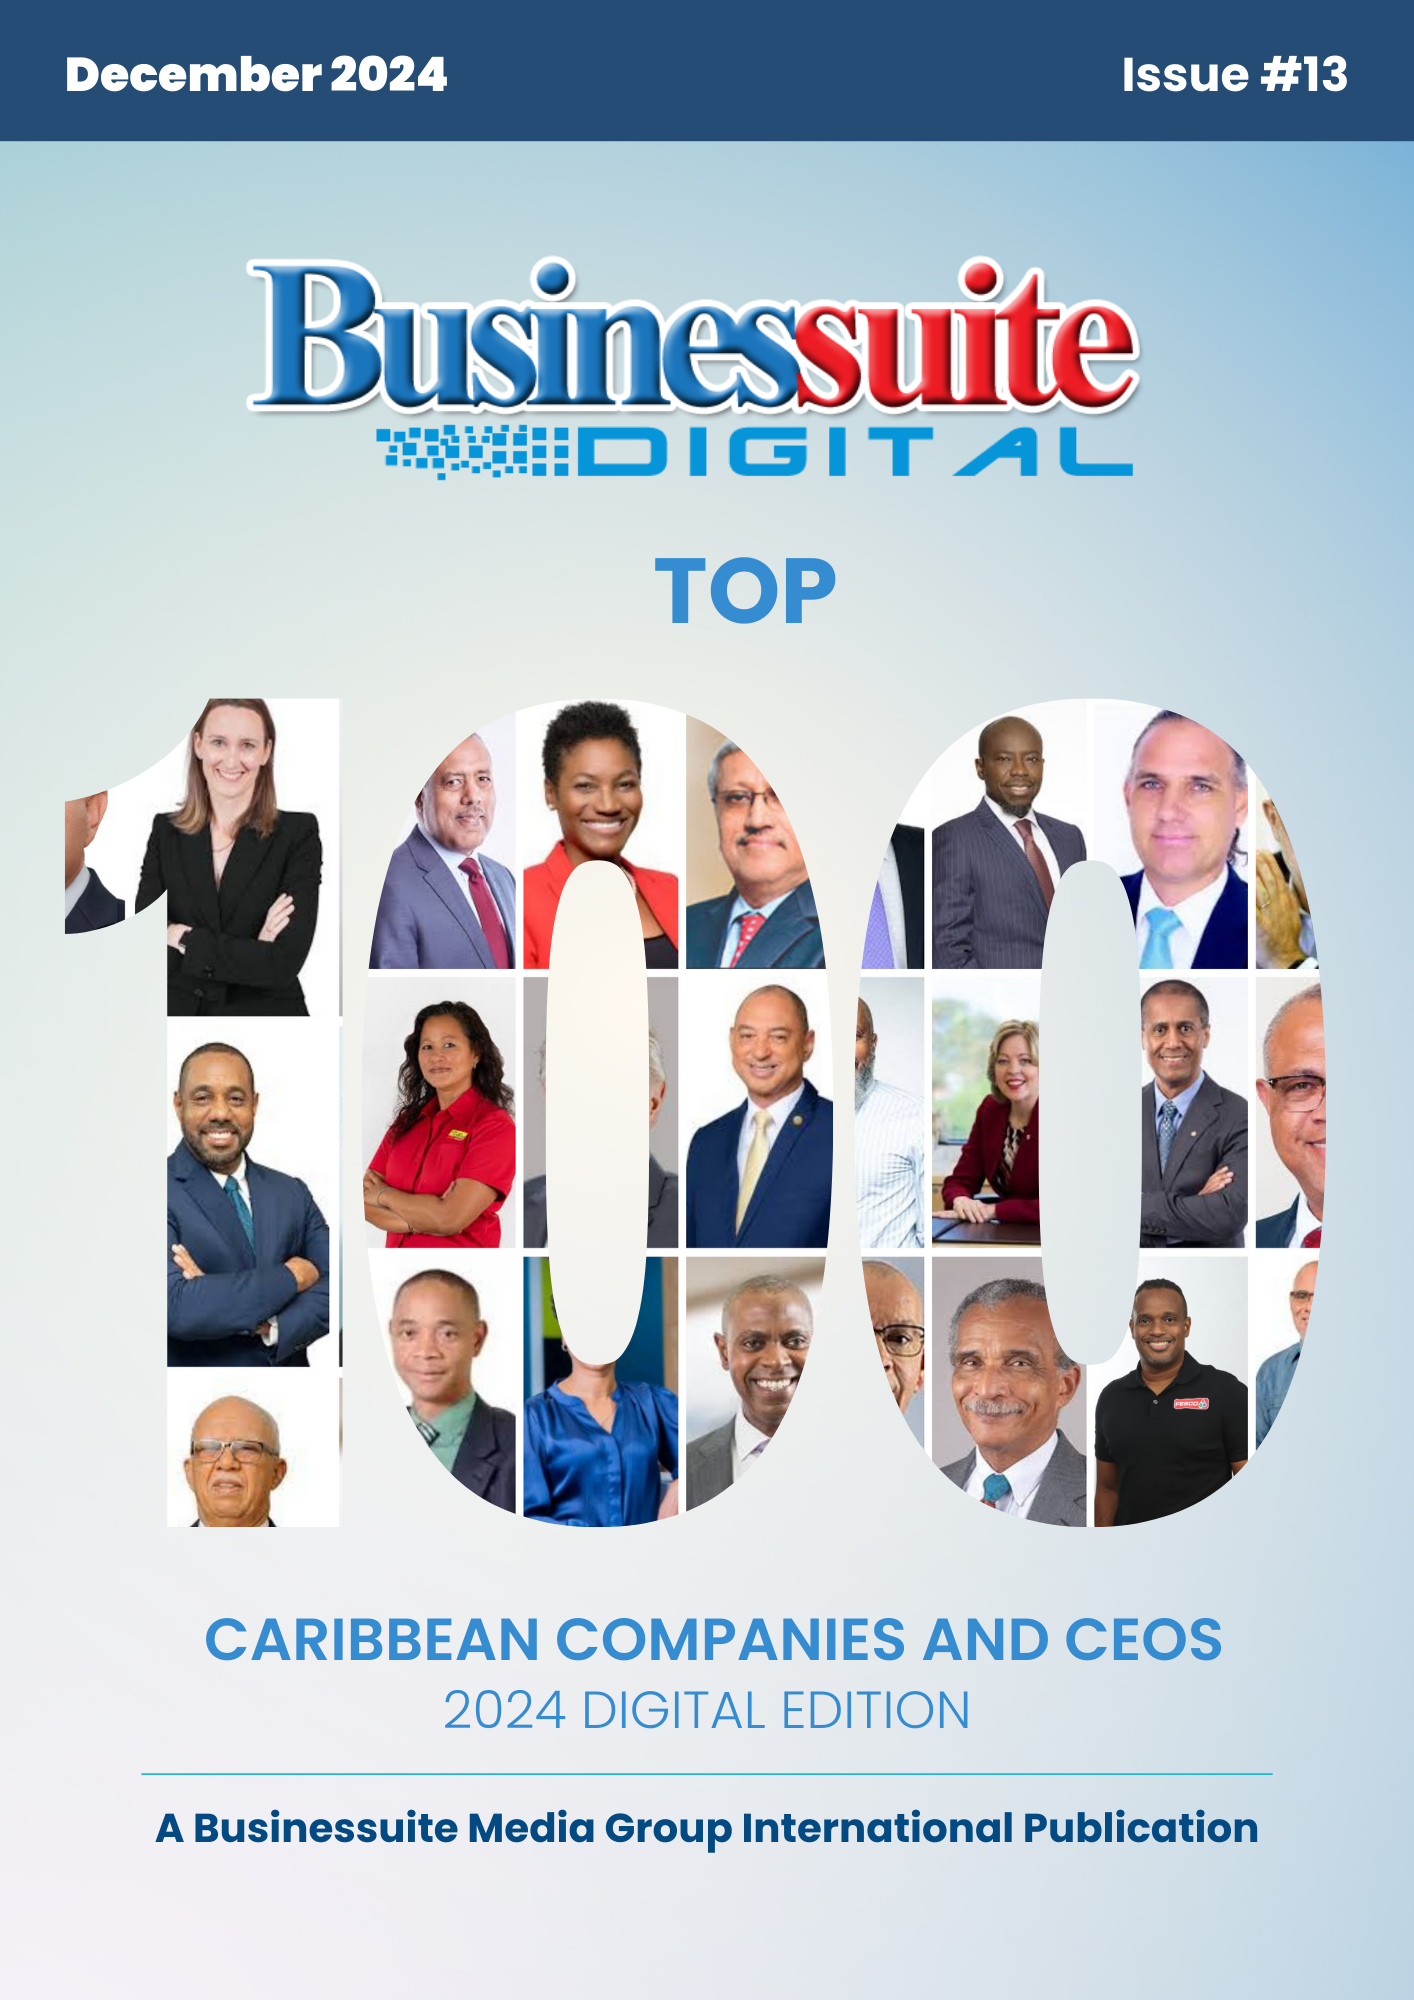
The Businessuite 2024 Caribbean Top 50 & 100 Editorial: Preparing For A New Caribbean Reality

Published

on

In the face of rapid economic, demographic, and technological shifts, Caribbean business leaders today navigate an environment marked by both promising growth opportunities and unprecedented challenges. From the pressing demands of Environmental, Social, and Governance (ESG) imperatives to the dual-edged influence of Artificial Intelligence (AI), the scope of leadership has expanded dramatically.

The declining birth rate and population growth across the region highlight an urgent demographic challenge. With aging populations, high emigration, and shifting family structures, the region faces a shrinking labour pool and a gradual transformation in consumer demand. Business leaders must re-evaluate strategies, invest in automation, attract talent creatively, and engage policymakers to build a resilient future.

Additionally, the adoption of advanced technologies, particularly AI, brings competitive advantages but also new cybersecurity risks that require robust protections and forward-thinking regulation. These pressures demand that companies adapt and safeguard their operations while responsibly implementing AI to build trust and ensure long-term sustainability.

This edition of Businessuite Top 100 delves into these critical issues with insights and actionable strategies, from innovative ESG practices to future-proofing operations amid demographic shifts and technological advancements. With contributions from top Caribbean firms, we explore how businesses can lead effectively in an era of constant change, underscoring the resilience, adaptability, and forward vision that the Caribbean’s business landscape needs now more than ever.

Businessuite remains committed to supporting Caribbean business leaders as they shape sustainable growth and inclusive prosperity for the region.

Continue Reading

RANKING

The Businessuite 2024 Caribbean Top 50 & 100 and the Ranking Methodology

Published

on

The Businessuite Caribbean Top 50 & 100 Companies ranking methodology and annual coverage aim to provide a structured view of the financial standing and influence of Caribbean businesses on a global scale.

This editorial introduction highlights the growing trend of Caribbean companies aiming for international expansion beyond the CARICOM market—a strategic move noted among major companies like GraceKennedy, Massy Group, and Goddard Enterprises. These companies are increasingly pursuing growth in markets like the USA, Canada, Latin America, and even parts of Africa and Europe, setting their ambitions beyond regional limitations.

The Businessuite Caribbean Top 100 rankings prioritize companies by annual revenue in US dollars, which allows for better comparison with Fortune and Forbes rankings. This method enables investors and business leaders to assess Caribbean companies against global corporations, despite the size disparity.

For instance, Massy Holdings Limited, leading the Caribbean list with about US$2.1 billion, would rank far below the smallest company on the Fortune 500, but still showcases substantial Caribbean corporate potential.

Beyond revenues, other financial indicators such as post-tax profit and market capitalization are also considered in the rankings. This multi-dimensional approach, modelled after established rankings like those by Fortune, reflects Businessuite’ s commitment to providing a credible benchmark for Caribbean companies, helping regional businesses to measure their growth and positioning globally.

Additionally, Businessuite has extended its publication footprint through digital channels, reaching investors and executives interested in Caribbean investment opportunities
.
For more on Businessuite’ s insights into Caribbean corporate performance, visit the official site at BusinessuiteOnline.com


Continue Reading

RANKING

Businessuite 2023 Top 100 Caribbean Companies – US$ Revenue  

Published

on

Businessuite 2023 Top 100 Caribbean Companies – US$  Revenue       
US$000 US$000
2023 Company 2022 2021
1 TT Massy Holdings Limited $1,824,063 $1,653,484
2 TT Guardian Holdings Limited $1,068,271 $1,041,146
3 JA NCB Financial Group Ltd. $997,548 $780,871
4 TT ANSA Mc Al Limited $962,452 $887,023
5 JA GraceKennedy Limited $953,105 $833,773
6 TT Republic Financial Holdings Limited $900,276 $862,188
7 JA Sagicor Group Jamaica Limited $647,516 $661,298
8 JA Jamaica Broilers Group Limited $609,247 $479,660
9 TT Agostini’s Limited $604,219 $536,127
10 BB First Caribbean International Limited $599,280 $543,052
11 JA Seprod Limited $523,017 $282,954
12 BB Goddard Enterprises Limited $484,416 $378,583
13 JA Supreme Ventures Limited $339,186 $283,530
14 TT First Citizens Group Limited $315,429 $318,201
15 JA Productive Business Solutions Limited $311,997 $223,997
16 TT Trinidad Cement Limited $304,016 $281,801
17 JA Scotia Group Jamaica Ltd. $285,363 $243,780
18 TT Scotiabank Trinidad & Tobago Limited $279,948 $257,089
19 JA Wisynco Group Limited $260,368 $205,148
20 JA JMMB Group Limited $240,488 $176,396
21 JA Jamaica Producers Group Limited $193,387 $161,330
22 GY Banks DIH Ltd. $190,431 $179,335
23 EC  The West Indies Oil Company Ltd. $181,450 $123,036
24 JA Caribbean Cement Company Limited $172,289 $153,717
25 TT Prestige Holdings Limited $162,997 $105,811
26 JA Lasco Distributors Limited $155,619 $130,802
26 TT Angostura Holdings Limited $151,904 $136,939
27 GY Demerara Distillers Ltd. (Group) $150,868 $138,271
28 EC St. Lucia Electricity Services Ltd. $147,634 $109,179
29 JA Derrimon Trading Company Limited $122,831 $114,416
30 JA Caribbean Producers Jamaica Ltd. $119,960 $58,178
31 JA Carreras Limited $108,195 $101,586
32 TT The West Indian Tobacco Company Limited $106,798 $126,635
33 TT ANSA Merchant Bank Limited (Group) $106,335 $171,745
34 JA General Accident Insurance Co Ja $100,785 $90,011
35 EC Grenada Electricity Services Limited $88,601 $66,027
36 JA Future Energy Source Company $84,494 $37,764
37 TT National Flour Mills Limited $78,585 $65,624
38 GY Republic Bank Guyana Ltd. $65,024 $59,504
39 JA Transjamaican Highway Limited $65,006 $52,755
40 JA Lasco Manufacturing Limited $63,223 $52,990
41 JA Kingston Wharves Limited $63,191 $55,929
42 JA Barita Investments Limited $59,692 $52,333
43 EC S. L. Horsford & Co Ltd. $54,629 $48,501
44 TT PLIPDECO Limited $53,667 $47,567
45 TT One Caribbean Media Limited $48,400 $45,715
46 JA Mayberry Investments Limited $46,423 $28,923
47 JA Proven Investments Jamaica Limited $45,971 $29,498
48 TT National Enterprises Limited $45,157 $4,945
49 JA Fontana Limited $42,297 $33,219
50 EC Dominica Electricity Services $41,567 $34,092
51 EC St. Kitts Nevis Anguilla Trading & Development Company $40,298 $42,856
52 TT Unilever Caribbean Limited $37,780 $34,649
53 JA Mayberry Jamaican Equities Limited $36,317 $18,465
54 JA Radio Jamaica Limited $36,252 $36,825
55 BB Insurance Corporation Of B’DOS Limited $36,092 $52,196
56 BB West India Biscuit Compant Limited $33,545 $30,712
57 GY Guyana Bank for Trade & Industry Ltd. $32,302 $27,787
58 GY Demerara Bank Limited $30,279 $27,104
59 EC East Caribbean Financial Holding Company $29,691 $27,271
60 EC Republic Bank (Grenada) Limited $25,499 $24,169
61 TT Trinidad and Tobago NGL Limited $24,820 $28,881
62 EC St. Kitts-Nevis-Anguilla National Bank Ltd. $23,418 $22,971
63 EC Grenada Co-operative Bank Ltd. $23,220 $21,265
64 GY Sterling Products Limited $22,800 $20,046
65 TT LJ Williams Limited $22,536 $22,483
66 JA FosRich Company Limited $22,492 $15,160
67 JA Berger Paints Jamaica Limited $21,977 $20,041
68 GY Citizens Bank Guyana Inc. $21,796 $18,034
69 EC Bank of St. Vincent and the Grenadines $20,158 $18,811
70 JA Honey Bun (1982) Limited $19,693 $13,833
71 JA Everything Fresh Limited $17,597 $10,412
72 JA Tropical Battery Company Limited $17,506 $12,877
73 TT Guardian Media Limited $17,373 $15,559
74 JA Lasco Financial Services Limited $16,750 $14,785
75 JA Jamaican Teas Limited $16,464 $14,638
76 JA Victoria Mutual Investments Limited – Group $15,918 $11,968
77 JA PanJam Investment Limited $15,677 $27,716
78 BB Cave Shepherd & Company Limited $15,536 $13,833
79 JA Dolphin Cove Limited $15,114 $7,640
80 JA Wigton Windfarm Limited $14,793 $13,213
81 JA Key Insurnace Company Limited $14,787 $12,347
82 JA Express Catering Limited $14,241 $4,412
83 JA Caribbean Cream Limited $13,907 $12,059
84 JA Access Financial Services Ltd. Group $13,193 $11,729
85 JA Stationery & Office Supplies Limited $11,657 $7,253
86 TT Endeavour Holdings Limited $11,621 $12,586
87 JA Paramount Trading (Jamaica) Limited $11,449 $9,269
88 JA Mailpac Group Limited $11,246 $11,734
89 JA Lumber Depot Limited $10,495 $9,216
90 JA Main Event Entertainment Group Ltd $10,329 $4,890
91 JA Sygnus Credit Investments Limited – Group $9,773 $11,125
92 JA First Rock Real Estate Investments Limited $9,359 $5,300
93 JA Consolidated Bakeries Jamaica Limited $9,111 $6,962
94 JA The Limners and Bards Limited $8,967 $7,913
95 JA Salada Foods Jamaica Limited $8,912 $7,671
96 JA 138 Student Living Jamaica Limited $7,908 $5,243
97 JA Jamaica Stock Exchange Limited $7,566 $6,435
98 JA Knutsford Express Limited $7,426 $4,058
99 JA CAC 2000 Limited $7,407 $6,744
100 JA IronRock Insurance Company Limited $7,363 $5,682
101 JA Spur Tree Spices Jamaica Limited $6,858 $5,543
102 JA AMG Packaging & Paper Company $6,640 $4,552
103 JA Indies Pharma Jamaica Limited $6,250 $5,460
104 JA Pulse Investments Limited $6,205 $5,204
105 JA Portland JSX Limited $5,584 $3,067
106 JA Image Plus Consultants Limited $5,184
107 JA Caribbean Flavours & Fragrances Ltd $5,149 $4,344
108 JA Dolla Financial Services Limited $4,933 $2,444
109 JA Regency Petroleum Co. Limited $4,542
110 JA Sygnus Real Estate Finance Limited – Group $4,425 $6,940
111 JA Palace Amusement Company (1921) Limited $4,328 $682
112 JA Elite Diagnostic Limited $4,162 $3,268
113 JA Blue Power Group Limited $3,510 $3,443
114 JA Kingston Properties Limited – Group $3,481 $3,133
115 JA Caribbean Assurance Brokers Limited $3,374 $2,986
116 JA Stanley Motta Limited $3,330 $3,176
117 JA JFP Limited $3,177 $1,507
118 JA Cargo Handlers Limited $3,150 $2,175
119 JA Eppley Limited $2,923 $2,493
120 JA ISP Financial Services Limited $2,876 $2,799
121 JA Magaritaville Ltd $2,618 $48
122 JA Ttech Limited $2,495 $2,529
123 JA One On One Educatinal Services Limited $1,780 $1,733
124 TT CinemaONE Limited $1,433 $308
125 JA Edufocal Limited $1,250 $1,194
126 JA GWEST Corporation Limited $975 $729
127 JA Sterling Investments Limited $830 $1,892

Continue Reading

RANKING

Businessuite 2023 #1 Caribbean Company by US$ Profit after Tax – National Enterprises Limited

Published

on

Businessuite 2023  #1 Caribbean Company By            US$ Profit after Tax
US$000 US$000
2023 Company 2022 2021
1 TT National Enterprises Limited $292,000 -$40,183

National Enterprises Limited (NEL) is an investment holding company incorporated on August 27, 1999 by the Government of the Republic of Trinidad and Tobago. NEL was formed to consolidate the Government’s shareholding in selected State Enterprises and facilitate public offerings on the Trinidad and Tobago Stock Exchange.

NEL has invested in industries that drive the economy of Trinidad and Tobago: natural gas and energy-based manufacturing, telecommunications, power generation, and the marketing and manufacturing of basic foods.

NEL holds significant shareholding in the following companies:

• NGC NGL Company Limited (NGC NGL);
• NGC Trinidad and Tobago LNG Limited (NGC LNG);
• Telecommunications Services of Trinidad and Tobago Limited (TSTT);
• Trinidad Nitrogen Co. Limited (TRINGEN);
• National Flour Mills Limited (NFM);
• NEL Power Holdings Limited (NPHL); and
• Pan West Engineers and Constructors, LLC (Pan West).

Through NEL, individual and corporate investors can share in the financial stability and staying power of these enterprises. Today, over 5,000 citizens who will continue to benefit from our consistent dividend payments own 100 million of the 600 million issued shares in NEL.

As of September 30, 2022, the fair market value of National Enterprises Limited’s (NEL) equity investments in subsidiaries, joint ventures and associate companies based on IFRS 9, was TT$3.42 Billion, an increase of 92% compared to the $1.78 Billion as of March 31, 2021, the last reporting date.

NEL’s Financial Position
For the financial period ended September 30, 2022 (FY2022), NEL recorded a net profit of $1.98 Billion, an increase of over $2 Billion as compared to the previous financial year (FY2021), where NEL recorded a loss of $270 Million.

NEL’s increased net profit over the eighteen-month financial period ended September 30, 2022 includes the unrealized fair value gain of $1.7 Billion from NEL’s portfolio companies in the energy sector.

NEL Power Holdings increased by $21.3 Million or 19.7% over its value as of March 31, 2021. This was offset by declines in the fair values of Telecommunications Services of Trinidad and Tobago Limited (TSTT) and National Flour Mills Limited (NFM).

NEL also registered an operating profit of $297 Million in FY2022 versus the $28 Million recorded in financial year ended March 31 2021 (FY2021).

Management has continued with prudent cost management practices while pursuing operational efficiencies. Operating expenses in FY22 have remained consistent at $8.8 Million for the eighteen-month period compared to $4.99 Million for the twelve-month FY2021.

Charles Maynard
General Manager National Enterprises Limited

For More Information CLICK THIS LINK

Businessuite 2023  #1  Trinidad and Tobago Company by US$ Profit after Tax – National Enterprises Limited

Continue Reading

RANKING

Businessuite 2023 #1 Caribbean Company By US$ Revenue  – Massy Holdings Limited

Published

on

Businessuite 2023 #1 Caribbean Company by US$  Revenue  
US$000 US$000
2023 Company 2022 2021
1 TT Massy Holdings Limited $1,824,063 $1,653,484

2022 was the 99th year of operations for the Massy Group of Companies, formerly Neal & Massy. Given the tumultuous environment in the world today, coupled with the success the Group has experienced in focusing on its three main Portfolios and success in international expansion, we have created a new vision for the Massy Group as it approaches 100 years of operations:

“A Global Force For Good, An Investment Holding Company with a Caribbean Heart”

Several developments have inspired this new vision. First, we are called to expand our sphere of influence beyond the Caribbean Basin. We recognise that our Purpose and Values resonate with people from diverse backgrounds, religions, and races.

The Group has never been more profitable and our Balance Sheet has never been stronger.

Operating Profit from Business Units grew by 25 percent from TT$961 million (US$143 million) in FY2021 to TT$1.2 billion (US$178 million) in FY2022.

Profit Before Tax (PBT) from Continuing Operations grew by 11 percent from FY 2021 to FY 2022; growth was impacted by the underperformance of the overseas cash investments held by the Group in FY2022 compared to the significant gains produced in those investments in FY 2021.
The Group’s Debt to Equity is down to 25 percent and in addition to its TT$1.2 billion in cash at the end of the year, the Group has US$176 million invested overseas to fund acquisitions and growth initiatives.

The Group’s governance has been strengthened with the creation of Portfolio Boards of Directors with Independent Directors and with increased autonomy and decision-making being implemented throughout our operations.

Mr. E. Gervase Warner, President &
Group CEO
Massy Group of Companies

For More Information CLICK THIS LINK

Businessuite 2023 #1 Trinidad and Tobago Company by US$ Revenue –  Massy Holdings Limited

Continue Reading

Trending

0
Would love your thoughts, please comment.x
()
x